Overview of mass spectrometry flow technique and depth analysis method of tissue cell population
Data Driven Research: Deep analysis of tissue cell populations
- Magical mass spectrometry
Mass spectrometry is a breakthrough in single-cell analysis technology and is currently used in many research fields such as blood, immunity, stem cells, and tumors. It creatively uses metal elements as labels for antibodies and uses single-cell multi-parameter detection using ICP mass spectrometry. The metal tag has a very low background signal and good label chemical stability, combined with the ultra-high signal resolution of the ICP detector, ensuring high quality data in mass spectrometry. Since the number of detection channels has reached several dozen, the mass spectrometry data contains a large amount of information.
So what information can we get from the data obtained by the mass spectrometry streaming platform? How do you make the most of these data results for analysis and improve the efficiency of a single experiment? In fact, different data analysis methods give different functions to the mass spectrometry. Here, this article will give a brief summary of some of the most common data analysis methods and result types.
First, the system displays the organizational subgroup composition as well as the function and status information - Data Visualization
Mass spectrometry data contains all aspects of the cell being measured and is high-dimensional data; the complexity of this data is actually a faithful portrayal of the heterogeneity of the tissue itself. After obtaining these data, the first thing researchers want to know is the composition of the subgroup of the organization. Although this information is already included in the data, it still needs to be processed to be transformed into an intuitive and easy-to-understand chart. This process is the visualization of the data.
SPADE is a commonly used method of data visualization. It first clusters cells with similar phenotypes into small groups, then performs cluster analysis according to the phenotypic similarity of each small group, and finally obtains a tree diagram. Each node (Node) on the SPADE tree is composed of a group of cells with similar phenotypes. The relative positions of the nodes also reflect the difference in phenotype. Therefore, the SPADE tree diagram visually shows the subpopulation of tissue cells.
Figure 1 shows the SPADE map of immune cells infiltrated in mouse melanoma at different stages. It can be clearly seen that the proportion of monocytes is significantly increased.
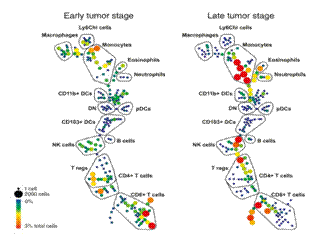
Figure 1. Subgroup composition of mouse melanoma infiltrating lymphocytes (SPADE analysis using 32 surface marker molecules, data source: Salmon et al., 2016, Immunity 44, 924–938 )
Dimensionality reduction analysis is another type of data processing method that is often used. It compresses multidimensional information into two dimensions on the basis of keeping information as much as possible. This allows two-dimensional scatterplots to display the structure of high-dimensional data. . Common methods are viSNE, PCA, etc.
Figure 2 shows the results of viSNE clustering of peripheral blood leukocytes based on 16 extracellular marker protein expression data. It can be seen that in the viSNE map, several major immune subpopulations are each clustered. Similarly, we can also show the changes of pSTAT5 in various subpopulations under different stimulation conditions in a “heat mapâ€. (Adeeb H et al, 2015)
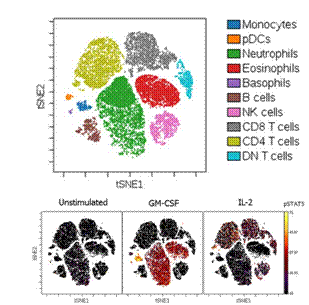
Figure 2. ViSNE analysis of human peripheral blood immune cells by 16 Marker (Source: Adeeb H. Rahman, Cytometry Part A , Volume 89, Issue 6, 2016 )
In addition to SPADE and viSNE, there are many ways to visualize data, such as PCA, Scaffold Map FLOW-MAP, etc.
Second, more precise automatic grouping than manual door setting - Automated population identification
The above method can perform visual data analysis on subgroups of known phenotypes under the premise of existing knowledge, and display complex group composition. When the phenotype of the key subgroup is unknown, an automatic clustering method that can fully exploit the mass spectrometry data is needed. This computer-independent subgroup analysis method is called "DensVM."
Mouse myeloid cells have complex cell composition. The human source of Singapore SIgN uses mass spectrometry to detect myeloid cells from different tissues. Figure 3 shows the results of viSNE analysis. Marked in different colors in the figure are 28 subpopulations of cells that are automatically recognized by the computer. Heat map analysis in Panel B shows that these subpopulations have different protein expression patterns. Obviously, this computerized automatic grouping method is much more detailed than the manually identified subgroups (blue wireframes). For example, only five subtypes with different phenotypes were identified in the blue wireframe of Neutrophils.
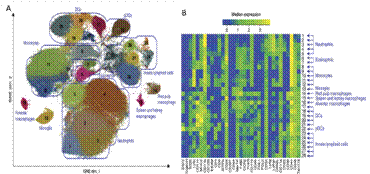
Figure 3. Composition of myeloid cells in different tissues of mice (A viSNE map; phenotypic analysis of each subgroup of B computer recognition; data source Nat Immunol. 2014 Dec;15(12) )
There are many analytical methods for similar functions. Accense, PhenoGraph, etc. are subgroup grouping methods that are often used in mass spectrometry. They can help us identify subpopulations of cells, rare subpopulations, and unknown subpopulations that play important roles in physiological or pathological conditions.
Third, finely analyze the dynamic process of cell maturation, differentiation, and programming - Cell development modelling
In addition to the static analysis of subpopulations of tissue cells, mass spectrometry can also perform detailed analysis of complex dynamic processes such as cell differentiation and deprogramming.
We illustrate this problem by taking the maturation process of B cells in the bone marrow as an example. We know that B cells are mature in the bone marrow, and there are cells in the bone marrow sample from the different stages of differentiation between hematopoietic stem cells (HSC) and Immature Naïve B; in general, these differentiation stages have no absolute boundaries, and during this period, There are a large number of transitional cells, which is the continuity of the B differentiation process.
So in theory, as long as we can detect enough bone marrow cells, we can measure enough intermediate transition cells, we can arrange these cells according to the gradual change of cell phenotype. This is the basic idea of ​​Wanderlust's analysis, which allows us to obtain dynamic information about cell differentiation from a single bone marrow sample.
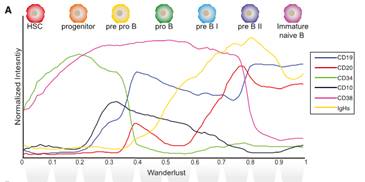
Figure 4. Wanderlust analysis showing the process of human B cell maturation in the bone marrow
(Source: Sean C. Bendall et al, Cell 157, 714–725 )
Wanderlust assigns a Wanderlust value to the cells according to the position of each cell array, the size of which reflects the degree of differentiation: 0 represents the starting point (hematopoietic stem cells), 1 represents the end point (Immature Naïve B), the smaller the value, the more primitive the cells;
With this tool, we can observe changes in the expression of any protein during B cell differentiation. This information can help us find some important events in the differentiation process.
For some in vitro experimental systems, we can use a simpler method to observe the changes in cell phenotype. It is only necessary to put the mass spectrometry data at different time points for the dimensionality reduction analysis, and the obtained spectrum reflects the change of the cell phenotype with time. The Flow-MAP map in Figure 5 reflects the whole process of MEF cells induced into iPSC in vitro. The color represents the length of time the sample is processed. Along the "time axis" from blue-yellow-red, we can see the process of cell phenotype during MEF deprogramming.
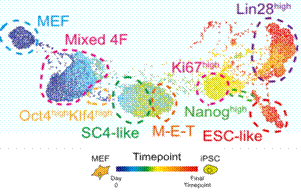
Figure 5. Flow-MAP analysis of the deprogramming process of MEF cells
(Source: Eli R. Zunder et al, Cell Stem Cell 16, 323–337 )
Fourth, quantitative analysis of the interaction between signal pathway molecules
Mass spectrometry is superior in the detection of phosphorylated proteins in signaling pathways. On the one hand, it can detect more signal pathway molecules, and on the other hand, the stability of the metal label of the antibody is greatly improved relative to the fluorophore. We know that there are complex interactions between signal pathway proteins, and mass spectrometry can quantify this relationship.
What is used here is an analysis method called DREVI, which helps us extract the "function relationship" between two signal pathway proteins from single-cell data and quantify this relationship with a series of parameters. Figures I and II below show the relationship between pCD3ζ and pSLP76 under different stimulation conditions. It can be easily seen that under the second stimulation condition, a lower pCD3ζ level can initiate SLP76 phosphorylation, and pSLP76 can reach a higher level.
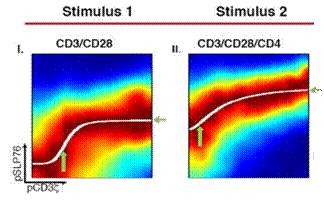
Figure 6. DREVI analysis can visually show changes in signal path status under different stimulus conditions.
(Source: SmithaKrishnaswamy et al, Science. 2014 November 28; 346 (6213) )
5. Looking for Bio-Marker with clinical guidance
In more clinically relevant studies, we often need to compare a series of patient samples with normal samples to identify patient sample characteristics. In general, it is difficult to find a statistically significant difference from the overall protein expression level, because clinical samples are highly heterogeneous, and regular and representative differences often exist only in a few subgroups. As mentioned above, the mass spectrometry stream can finely divide the sample into many subgroups, so it can conveniently compare and analyze the expression data of related proteins in these subgroups.
Researchers at Stanford University used mass spectrometry to detect the expression of 39 proteins in multiple myeloma cases and normal human peripheral blood cells. To find Bio-Marker with significant differences between the two sets of samples, they introduced the Citrus analysis. Firstly, through the 24 surface Marker clusters, it was divided into dozens subgroups, and then by comparing the expression of 14 proteins in each subgroup, the two B cell related subpopulations shown in the figure were finally discovered (Cluster A and Cluster). B) In these two subpopulations, the expression level of CD27 in patients with multiple myeloma was significantly higher than that in normal subjects. This difference is promising as a BioMarker for the diagnosis of the disease.
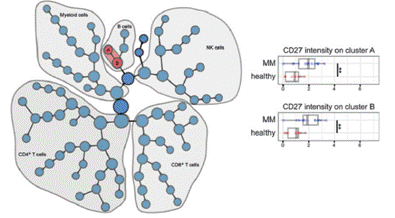
Figure 7. Identification of characteristic subpopulations of multiple myeloma by Citrus analysis
(Source: Leo Hansmann et al, Cancer Immunol Res; 3(6) June 2015 )
Summary: Data-driven research methods, constantly lowering technology thresholds
It can be seen that the mass spectrometry data analysis has great flexibility. The researcher can select several suitable analysis methods according to the experimental design and the purpose of the experiment, and effectively extract the required information. This type of research is also known as Data Driven Research.
After several years of development, the mass spectrometry data analysis method has gradually become a system. With the advent of some cloud-based online analytics systems, the technical threshold for data analysis has also been greatly reduced. For example, Cytobank can support a variety of data analysis methods such as SPADE, viSNE and Citrus. The software interface is also very friendly. The researchers only need to upload the data to the server and set a few parameters to complete the analysis. This also creates favorable conditions for the popularization of mass spectrometry.
Roasted Pumpkin Seeds,Baking Pumpkin Seeds,Cooking Pumpkin Seeds,Toasted Pumpkin Seeds
Wuyuan county dafeng oil food co.,ltd , https://www.dafengfood.com.cn