Optimization of high-concentration antibody processes using hollow fiber tangential flow filtration (HF TFF)
Background / Introduction
Antibodies (Abs), or immunoglobulins (Ig), are widely used in many different scientific and therapeutic applications 1 . In particular, the use of monoclonal antibodies (mAbs) in diagnostics, protein purification, and medical applications has increased significantly 2-5 . A major obstacle to the use of therapeutic mAbs is that subcutaneous injections require higher concentrations because this is the preferred method of administration. According to FDA requirements, when administered subcutaneously, the injection volume should be less than 1.5 ml, which means that the concentration of the preparation should be higher than 100 mg/ml 7 . However, such a high concentration of mAb preparations on it will be no small challenge, issues include stability, solubility, high viscosity and aggregation 8,9. Ab formulations will have similar problems.
Hollow fiber tangential flow filtration (HF TFF) is an excellent method for preparing high-concentration Abs formulations compared to flat membrane pack filters because the fiber lumen exhibits non-turbulent hydrodynamics and achieves significantly lower pressure drop. For most high-concentration Ab applications using membrane-packaged TFF filters, the injection pump needs to be lowered to maintain a constant pressure as the viscosity of the antibody increases. In HF TFF, there is no need to control the injection pump because the pressure increase is very small. In addition, when using an HF filter, the harvesting and emptying of the product is also very simple, since it does not have a turbulence promoter or screen that is typically used in membrane pack filters. Finally, the use of disposable HF filters eliminates cumbersome cleaning, assembly, disassembly, and maintenance steps, ultimately saving the time and indirect costs associated with traditional membrane pack filters.
This application tested the feasibility of using HF membranes for efficient concentration of IgG and analyzed the effect of shear rate and transmembrane pressure (TMP) on filtrate flux.
Materials and Method
System: KR2i TFF System (SYR2-U20, SpectrumLabs.com)
Filter: 30kDa mPES, MicroKros (C02-E030-05-N, 0.5mm; C02-E030-10-N, 1.0mm, SpectrumLabs.com)
Sample preparation
IgG was a commercial product (Sigma Aldrich) dissolved in 0.9% saline solution to a final concentration of 30 mg/mL. Prior to the experimental run, the solution was filtered using a 0.2 μm filter to remove larger particles.
The initial and final concentrations of IgG were determined by 280 nm spectrophotometry and the concentration was calculated using the Beer method. ε 280 = 210,000 M -1 cm -1 .
Filter component preparation
Prior to the concentration experiment, the filter assembly was wetted and tested for integrity. The MicroKros filter assembly has a molecular weight cut off (MWCO) of 30 kDa and contains modified polyethersulfone (mPES) fibers. In this application note, the experimental fiber diameter (ID) is 0.5 mm (6 fibers per component, 20 cm 2 ) ) or 1.0mm (each component contains 2 fibers, 13cm 2 ) components. Component wetting and integrity testing was performed using the KR2i TFF system. Briefly, the filter assembly was rinsed with DI water until the filtrate volume per cm2 surface area was 2 ml. Test fiber and component integrity using a leak test. The assembly is completely wetted and the outer fiber chamber (ECS) is completely submerged with water. The return end is closed and air is slowly introduced into the assembly through the inlet. When the transmembrane pressure (TMP) reaches ~0.5 psi, the pump is stopped. There is no air bubble in the ECS and the injection pressure is constant, indicating a complete filter assembly. After the integrity check, the filter was rinsed with a 0.9% salt solution until 2 mL/cm 2 of filtrate was collected.
Concentration experiment
Concentration experiments were performed using the KR2i TFF system. The experiment used an HF film with a fiber inner diameter of 0.5 and 1.0 mm and sheared to 6,000 S -1 . Data was collected using integrated KF Comm software (flow rate, pressure, etc.). The IgG solution (30 mg/mL) was added to a conical bottom container (containing 3 catheter caps, SpectrumLabs.com). The filtrate line is connected to a collection vessel. The concentration process was monitored by measuring the mass of the collected filtrate and was automatically detected by KF Comm software. Within 3 seconds, slowly increase the pump speed to the desired flow rate (6,000 S -1 shear) and pump the protein solution into the assembly. The KR2i system is set to the concentrated (C) mode.
Shear rate experiment
To test the effect of different shear rates on filtrate flux, an IgG solution (~100 mg/mL) was circulated through the HF membrane. To ensure that the IgG concentration was constant throughout the process, the IgG solution was continuously washed with 0.9% saline solution. The system setup is identical to the C mode, but the third conduit of the cone bottom sample container is connected to the buffered auxiliary container instead of the connected air. The flow path continuously adds a buffer to the IgG solution through a vacuum formed during the process at a rate consistent with the filtrate flow rate. The shear rate experiment was carried out at a flow rate that provided the appropriate shear rate without applying back pressure. The experiment was carried out using a filter assembly containing 0.5 and 1.0 mm internal diameter HF membranes, and data acquisition was performed using KF Comm software.
Transmembrane pressure (TMP) experiment
The effect of transmembrane pressure (TMP) on filter performance was tested by applying a back pressure to the return line at a constant shear rate. The experiment was carried out using a MicroKros filter assembly containing 0.5 and 1.0 mm internal diameter HF membranes. The experiment used shear rates of 6,000 and 10,000 S -1 . The experimental setup is similar to the shear rate experiment and there is only one difference that needs to be noted. In a concentration/wash filter (C/D) mode, a secondary wash filter was used to continuously add a buffer (0.9% salt) to the protein solution to maintain a constant IgG concentration of 30 mg/mL throughout the experiment. (The concentration factor is set to 1 so that the wash filter starts immediately). Data was acquired using KF Comm software.
Results and discussion
Concentration experiment (0.5mm inner diameter)
In the initial experiment, we used HF membranes to test the maximum concentration of IgG that can be concentrated. A MicroKros assembly containing 0.5 mm inner diameter fibers was used. In the experiment, 20 mL of a 30 mg/mL IgG solution (0.9% saline solution) was placed in a 50 mL cone-bottomed process vessel containing a 3-gauge cap. Two conduits are connected to the injection and return lines of the assembly, and the third conduit is connected to the air.
The filtrate line is closed and the IgG solution is slowly pumped into the tubing and components. When the circulation flow rate is constant, the filtrate line is opened and concentration begins. In this experiment, no external back pressure was applied (through the return line), so the TMP increased as the viscosity increased as the solution concentration increased. The injection flow rate of 27 mL/min (6,000 S -1 shear) was also kept constant.
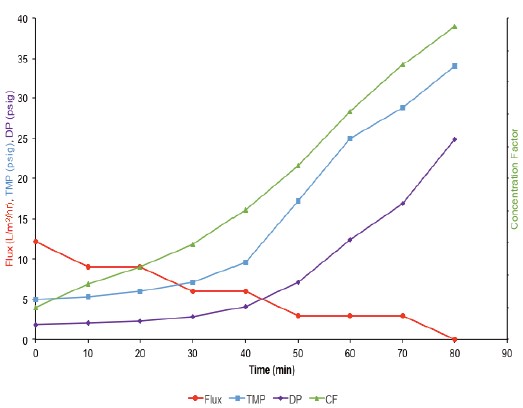
Figure 1. Flux, TMP, pressure drop (DP), and concentration factor (CF) data for a high concentration experiment using a MicroKros module with a 0.5 mm ID mPES HF membrane.
As shown in Figure 1, TMP immediately began to increase after the start of concentration. At the same time, the flux began to decline steadily. The pressure drop across the assembly (DP) can be used as an indicator of membrane fouling, often with the process involved in the concentration step. However, Figure 1 shows that the pressure drop is maintained below 10 psig even after 60 minutes from the start of the process. After 60 min, the pressure drop began to increase by more than 10 psig, eventually reaching about 25 psig, and the flux dropped to 0 L/m 2 /hr.
The final concentration of the IgG solution was determined by UV-spectrophotometry to be approximately 350 mg/mL, which corresponds to a concentration of ~12x.
Concentration experiment (1.0mm inner diameter)
We also performed a concentration experiment using a filter assembly containing a 1.0 mm fiber inner diameter HF membrane. The shear rate of the process was kept constant at 6,000 S -1 (71 mL/min.) TMP was controlled by an automatic back pressure valve and maintained at 5 psig. The result is shown in Figure 2.
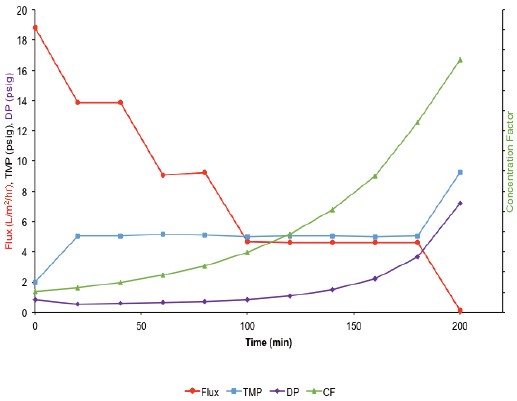
Figure 2. Flux, TMP, DP, and CF data for concentration runs using a MicroKros module with a 1.0 mm ID mPES HF membrane. The TMP remained constant at 5 psig during operation (except for the last data point).
As shown in Figure 2, the initial flux of the 1.0 mm inner diameter fiber is higher than the 0.5 mm inner diameter fiber (18 L/m 2 /hr vs. 12 L/m 2 /hr). As expected, the flux decreased as the concentration of the IgG solution increased. During operation, TMP was constant at 5 psig and increased to approximately 10 psig near the end of the run. At this time, the flux was lowered to 0 L/m 2 /hr. Figure 2 also shows that the total pressure is reduced to 8 psig throughout the run, indicating a low membrane fouling. This indicates that a 1.0 mm fiber can achieve better filter throughput during the concentration process.
The concentration of the IgG final solution was measured by UV spectrophotometry and was calculated to be about 226 mg/mL and concentrated 7.5 times. The use of a 1.0 mm inner diameter fiber requires the use of larger tubing to achieve a flow rate of 71 mL/min. A concentration higher than 250 mg/mL could not be obtained due to an increase in the retention volume. However, under optimized conditions, higher concentrations can be obtained.
Shear rate experiment
Since the pressure drop at the time of IgG concentration using the HF membrane is lower, a higher injection flow rate/shear rate can be used, and the processing time can be shortened. To examine the effect of shear rate on filtrate flow rate, IgG solution (~100 mg/mL) was cycled under increasing injection flow rate/shear rate conditions. No back pressure was applied during the experimental run.
For 0.5mm (Fig. 3) and 1.0mm (Fig. 4) fibers, increasing the shear rate increases the filtrate flux. As shown in Figure 3, the filtrate flux increases linearly with increasing shear rate. When the shear rate increases from 4,000 S -1 to 12,000 S -1 , the flux increases from 6 L/m 2 /hr to 10 L/m 2 , respectively. /hr. However, it should be noted that even at the lowest shear rate (4,000 S -1 ), the lowest TMP is still 5 psig, even without back pressure. When the shear rate was increased to 12,000 s -1 , the TMP increased to about 20 psig.
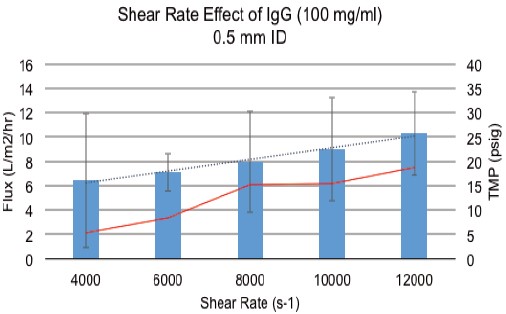
With a 0.5 mm inner diameter HF membrane, a 1.0 mm inner diameter HF membrane filter assembly showed a significant increase in filtrate flux with a large reduction in transmembrane pressure. Figure 4 shows that the filtrate flux increased by a factor of 4 from 4 L/m 2 /hr to 16 L/m 2 /hr. It is important that the transmembrane pressure remains essentially constant, even at a shear rate of 11,000 s -1 , which does not increase by more than 5 psig. At a TMP of 5 psig, a 0.5 mm id fiber can only achieve a filtrate flux of about 6 L/m 2 /hr.
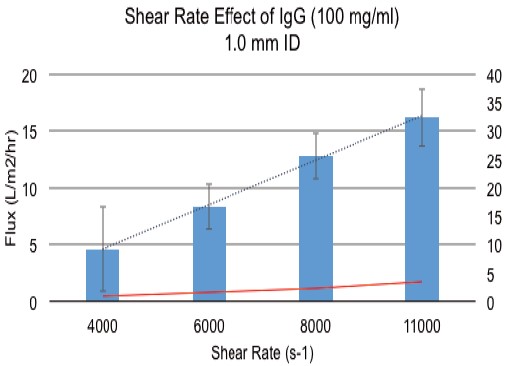
Figure 4. Effect of increasing shear rate on filtrate flux when using a 1.0mm ID HF membrane.
TMP experiment
In our final experiment, we tested the effect of applied back pressure on filter performance at a given shear rate. In this experiment, a filter assembly containing 0.5 and 1.0 mm inner diameter fibers was tested at 6,000 and 10,000 S -1 shear rate conditions, and TMP was increased from 5 to 20 psig. The results are shown in Figures 5 and 6. The experiment was carried out using a 30 mg/mL IgG solution (0.9% saline solution).
As shown in Figure 5, increasing back pressure has a negative effect on filtrate flux. When using a 0.5mm id fiber filter assembly, the flux is reduced from 14L/m 2 /hr to 9L when the shear rate is 6,000S -1 . m 2 /hr. This suggests that increasing the back pressure increases the formation of the gel layer and ultimately reduces filter performance. Interestingly, when the shear rate increased to 10,000 S -1 and the TMP returned to 5 psig, the filtrate flux increased to 18 L/m 2 /hr, indicating that the increased flow rate can sweep from the membrane surface and remove settled IgG. In addition, increasing TMP to 10, 15 and 20 psig did not adversely affect filtrate flux, indicating that at 10,000 S -1 , the increased shear rate effectively and continuously sweeps the membrane surface. This sweeping action prevents the formation of a gel layer even under high TMP conditions.
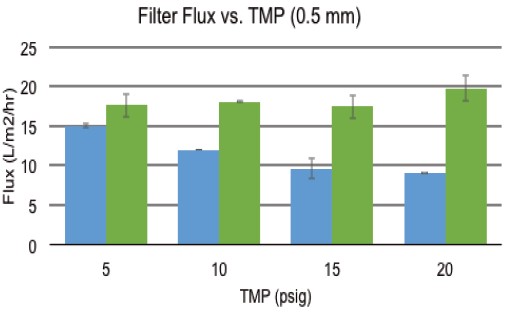
Figure 5. Effect of a 0.5 mm inner diameter HF film when TMP is increased by back pressure.
Figure 6 shows the results of a consistent experiment conducted using a 1.0 mm id fiber filter assembly. It can be seen that when shearing 6,000 or 10,000 S- 1 , the filtrate flux does not decrease as the TMP increases. Under all tested TMP conditions, the flux was maintained at approximately 15 L/m 2 /hr at a shear rate of 6,000 S -1 . At a shear rate of 10,000 S -1 , as TMP increased from 5 to 20 psig, the flux increased slightly from 20 to 23 L/m 2 /hr.
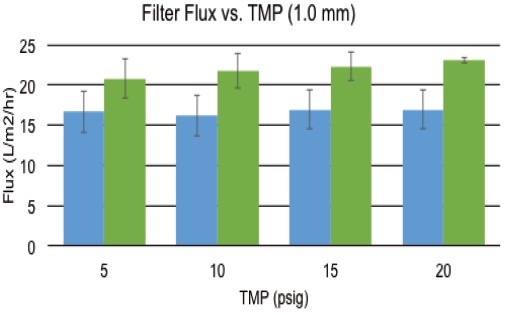
Figure 6. Effect of a 1.0 mm HR film on TMP when back pressure is increased.
to sum up
Here, we describe a process for concentrating IgG using an HF filter assembly containing 0.5 and 1.0 mm inner diameter fibers. This application note shows that using the HF membrane of Spectrumlabs.com, the IgG concentration can be concentrated to 350 mg/mL. In addition, we found that 0.5 and 1.0 mm inner diameter membranes have performance differences in this experiment.
These experiments show that a filter assembly containing 1.0 mm inner diameter fibers is more suitable for concentration of Abs. Using a 1.0 mm inner diameter fiber results in lower pressure drop and higher throughput, which reduces processing time.
At the same time, we found that applying back pressure to the process did not significantly increase filtrate flux. In some cases, back pressure reduces filtrate flux. Of course, each process requires its own series of experiments to optimize the parameters, but these results can be used as a good starting point (eg 6,000-8,000 S -1 , no back pressure applied).
In summary, using the HF membrane from SpectrumLabs.com, high Ab concentrations can be obtained quickly, gently, and stably, radically reducing product loss. In addition, due to the geometry and evacuation capabilities of the HF filter assembly, product isolation is maintained at a high level, further increasing the yield of the product. Combining these IgG results, a similar process can be used for the purification of mAbs.
references:
- Lipman, NS; Jackson, LR; Trudel, LJ; Weis-Garcia, F. ILAR Journal 2005, 46, 258.
- Weiner, LM; Surana, R.; Wang, S. Nat Rev Immunol 2010, 10, 317.
- Weiner, GJ Nat Rev Cancer 2015, 15, 361.
- Levy, NE; Valente, KN; Choe, LH; Lee, KH; Lenhoff, AM Biotechnology and Bioengineering 2014, 111, 904.
- Ecker, DM; Jones, SD; Levine, HL mAbs 2015, 7, 9.
- Shire, SJ; Shahrokh, Z.; Liu, J. Journal of Pharmaceutical Sciences, 93, 1390.
- Neergaard, MS; Nielsen, AD; Parshad, H.; De Weert, MV Journal of Pharmaceutical Sciences 2014, 103, 115.
- Shire,SJ; In Monoclonal Antibodies; Woodhead Publishing: 2015 p93.
- Shire,SJ; In Monocolnal Antibodies; Woodhead Publishing: 2015 p139.

Scan the QR code and pay attention to the official version of the WeChat public account to get more application information!
Purgative Extract,Probiotics,Relaxing Bowels,Constipation Relief
Shaanxi Zhongyi Kangjian Biotechnology Co.,Ltd , https://www.zyplantextract.com